Science across all disciplines has become increasingly data-driven, leading to additional needs with respect to software for collecting, processing and analysing data. Thus, transparency about software used as part of the scientific process is crucial to understand provenance of individual research data and insights, is a prerequisite for reproducibility and can enable macro-analysis of the evolution of scientific methods over time. However, missing rigor in software citation practices renders the automated detection and disambiguation of software mentions a challenging problem.
In this work, we provide a large-scale analysis of software usage and citation practices facilitated through an unprecedented knowledge graph of software mentions and affiliated metadata generated through supervised information extraction models trained on a unique gold standard corpus and applied to more than 3 million scientific articles. Our information extraction approach distinguishes different types of software and mentions, disambiguates mentions and outperforms the state-of-the-art significantly, leading to the most comprehensive corpus of 11.8 M software mentions that are described through a knowledge graph consisting of more than 300 M triples. Our analysis provides insights into the evolution of software usage and citation patterns across various fields, ranks of journals, and impact of publications. Whereas, to the best of our knowledge, this is the most comprehensive analysis of software use and citation at the time, all data and models are shared publicly to facilitate further research into scientific use and citation of software.
In the following figure, the data model of SoftwareKG_PubMed is illustrated.
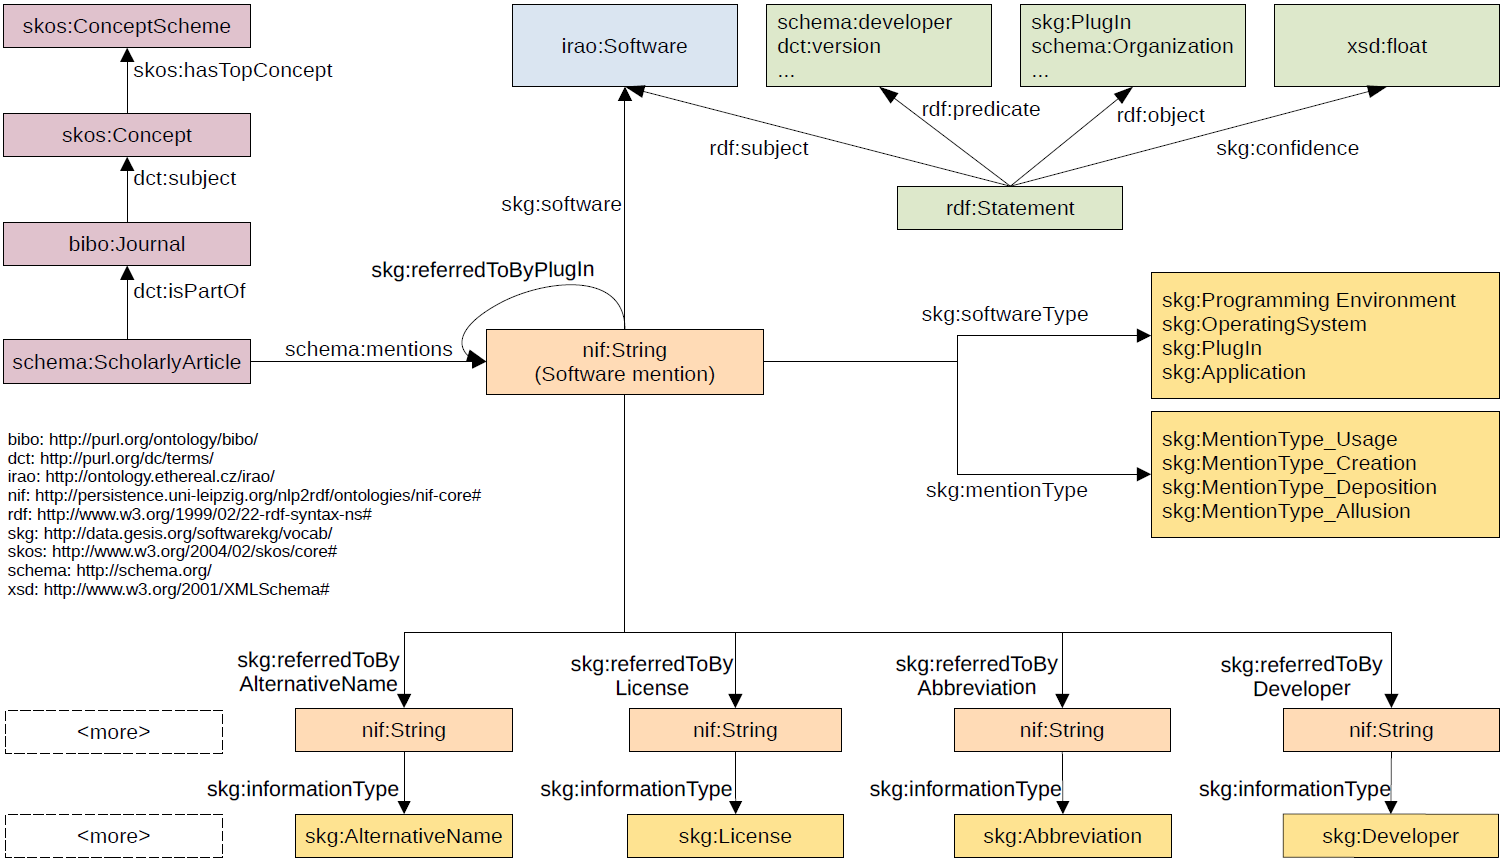
| Property | Frequency |
|---|---|
| Triples | 301,825,757 |
| Resources | 55,953,270 |
| Distinct Types | 12 |
| Distinct Properties | 47 |
| Reification Statements | 2,042,076 |
| Type | Frequency |
|---|---|
| nif:String | 22,066,759 |
| schema:Person | 20,373,227 |
| schema:Organization | 7,063,708 |
| schema:ScholarlyArticle | 3,215,346 |
| rdf:Statement | 2,042,076 |
| irao:Software | 605,352 |
| skg:SoftwareVersion | 380,234 |
| skg:JournalInformation | 134,369 |
| bibo:Journal | 15,338 |
| dct:LicenseDocument | 4,748 |
| skos:Concept | 303 |
| skos:ConceptScheme | 27 |
Cumulative distribution of software mentions per unique software. Left (bottom) scale gives the relative values, whereas right (top) scale provides the absolute numbers.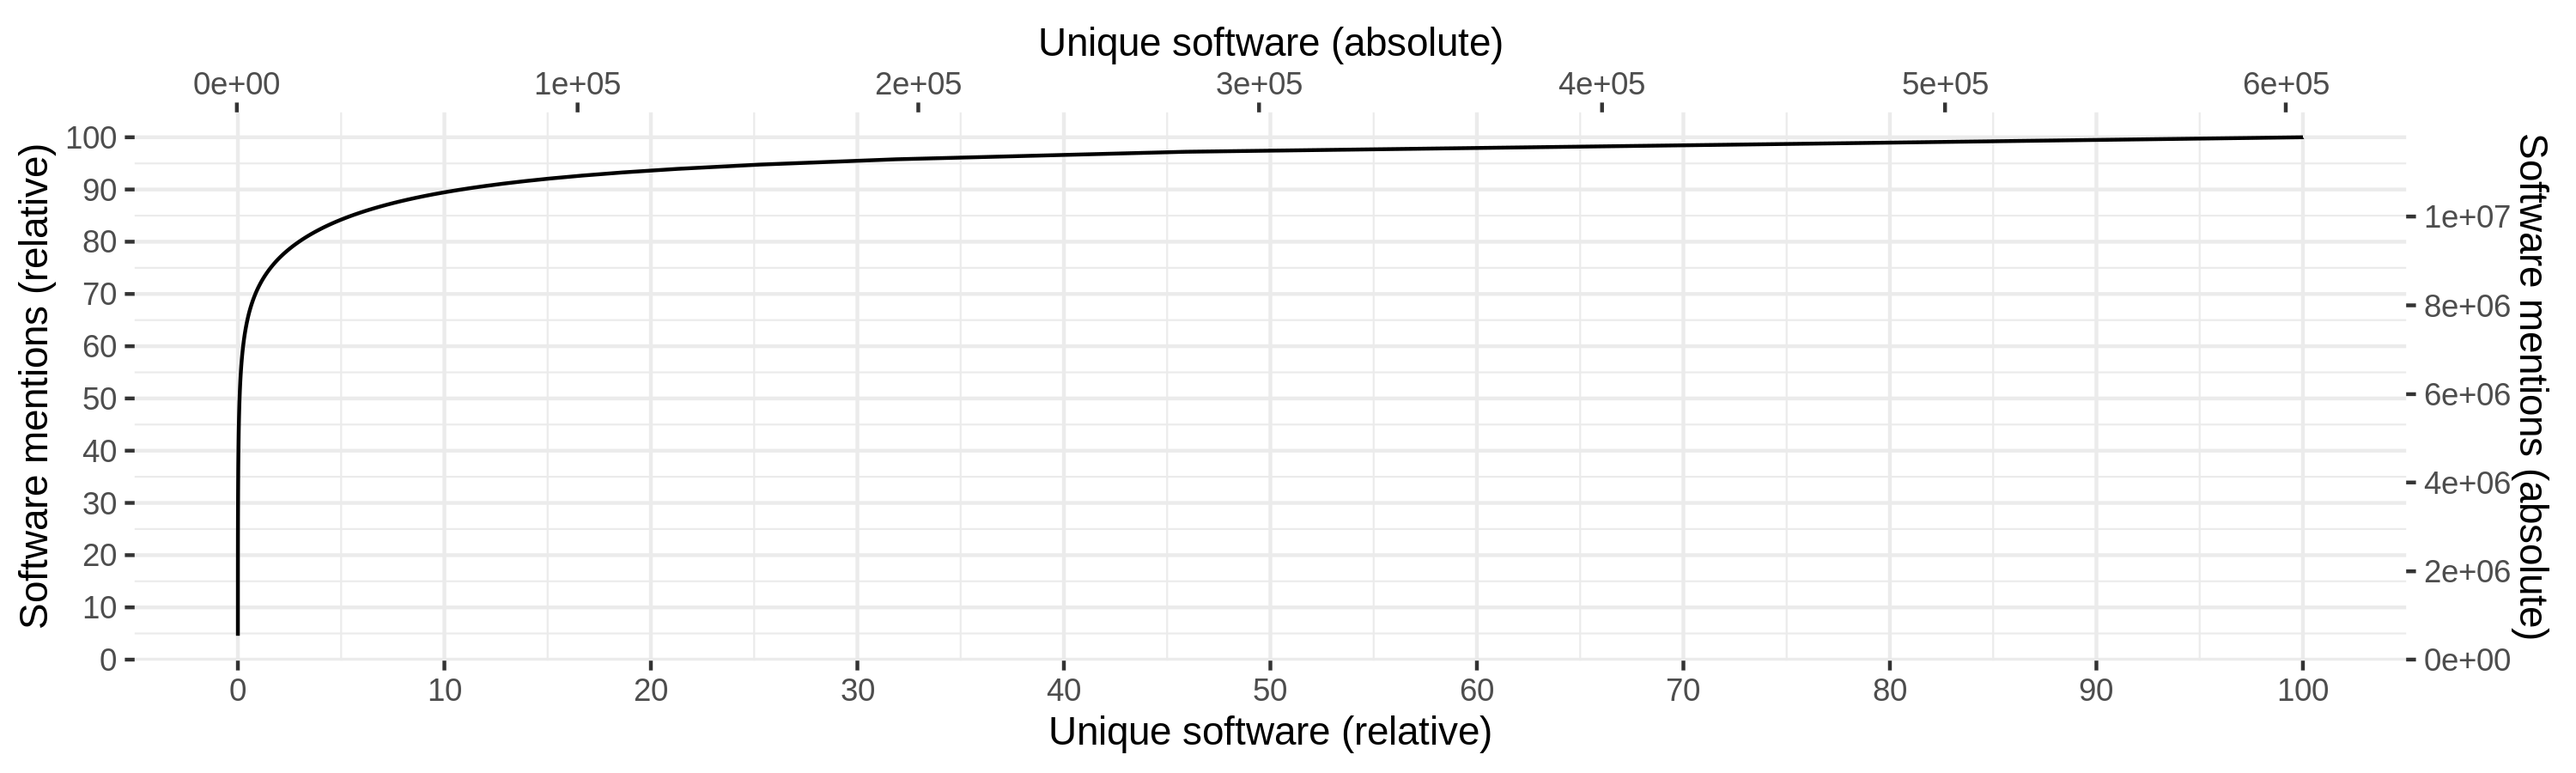
Top 10 software per domain. Higher rank within the domain is represented by darker color. The number on the tile gives the rank within the domain. Software with rank higher than 10, are excluded from the plot to improve readability. Software are ordered by rank over all domains left to right.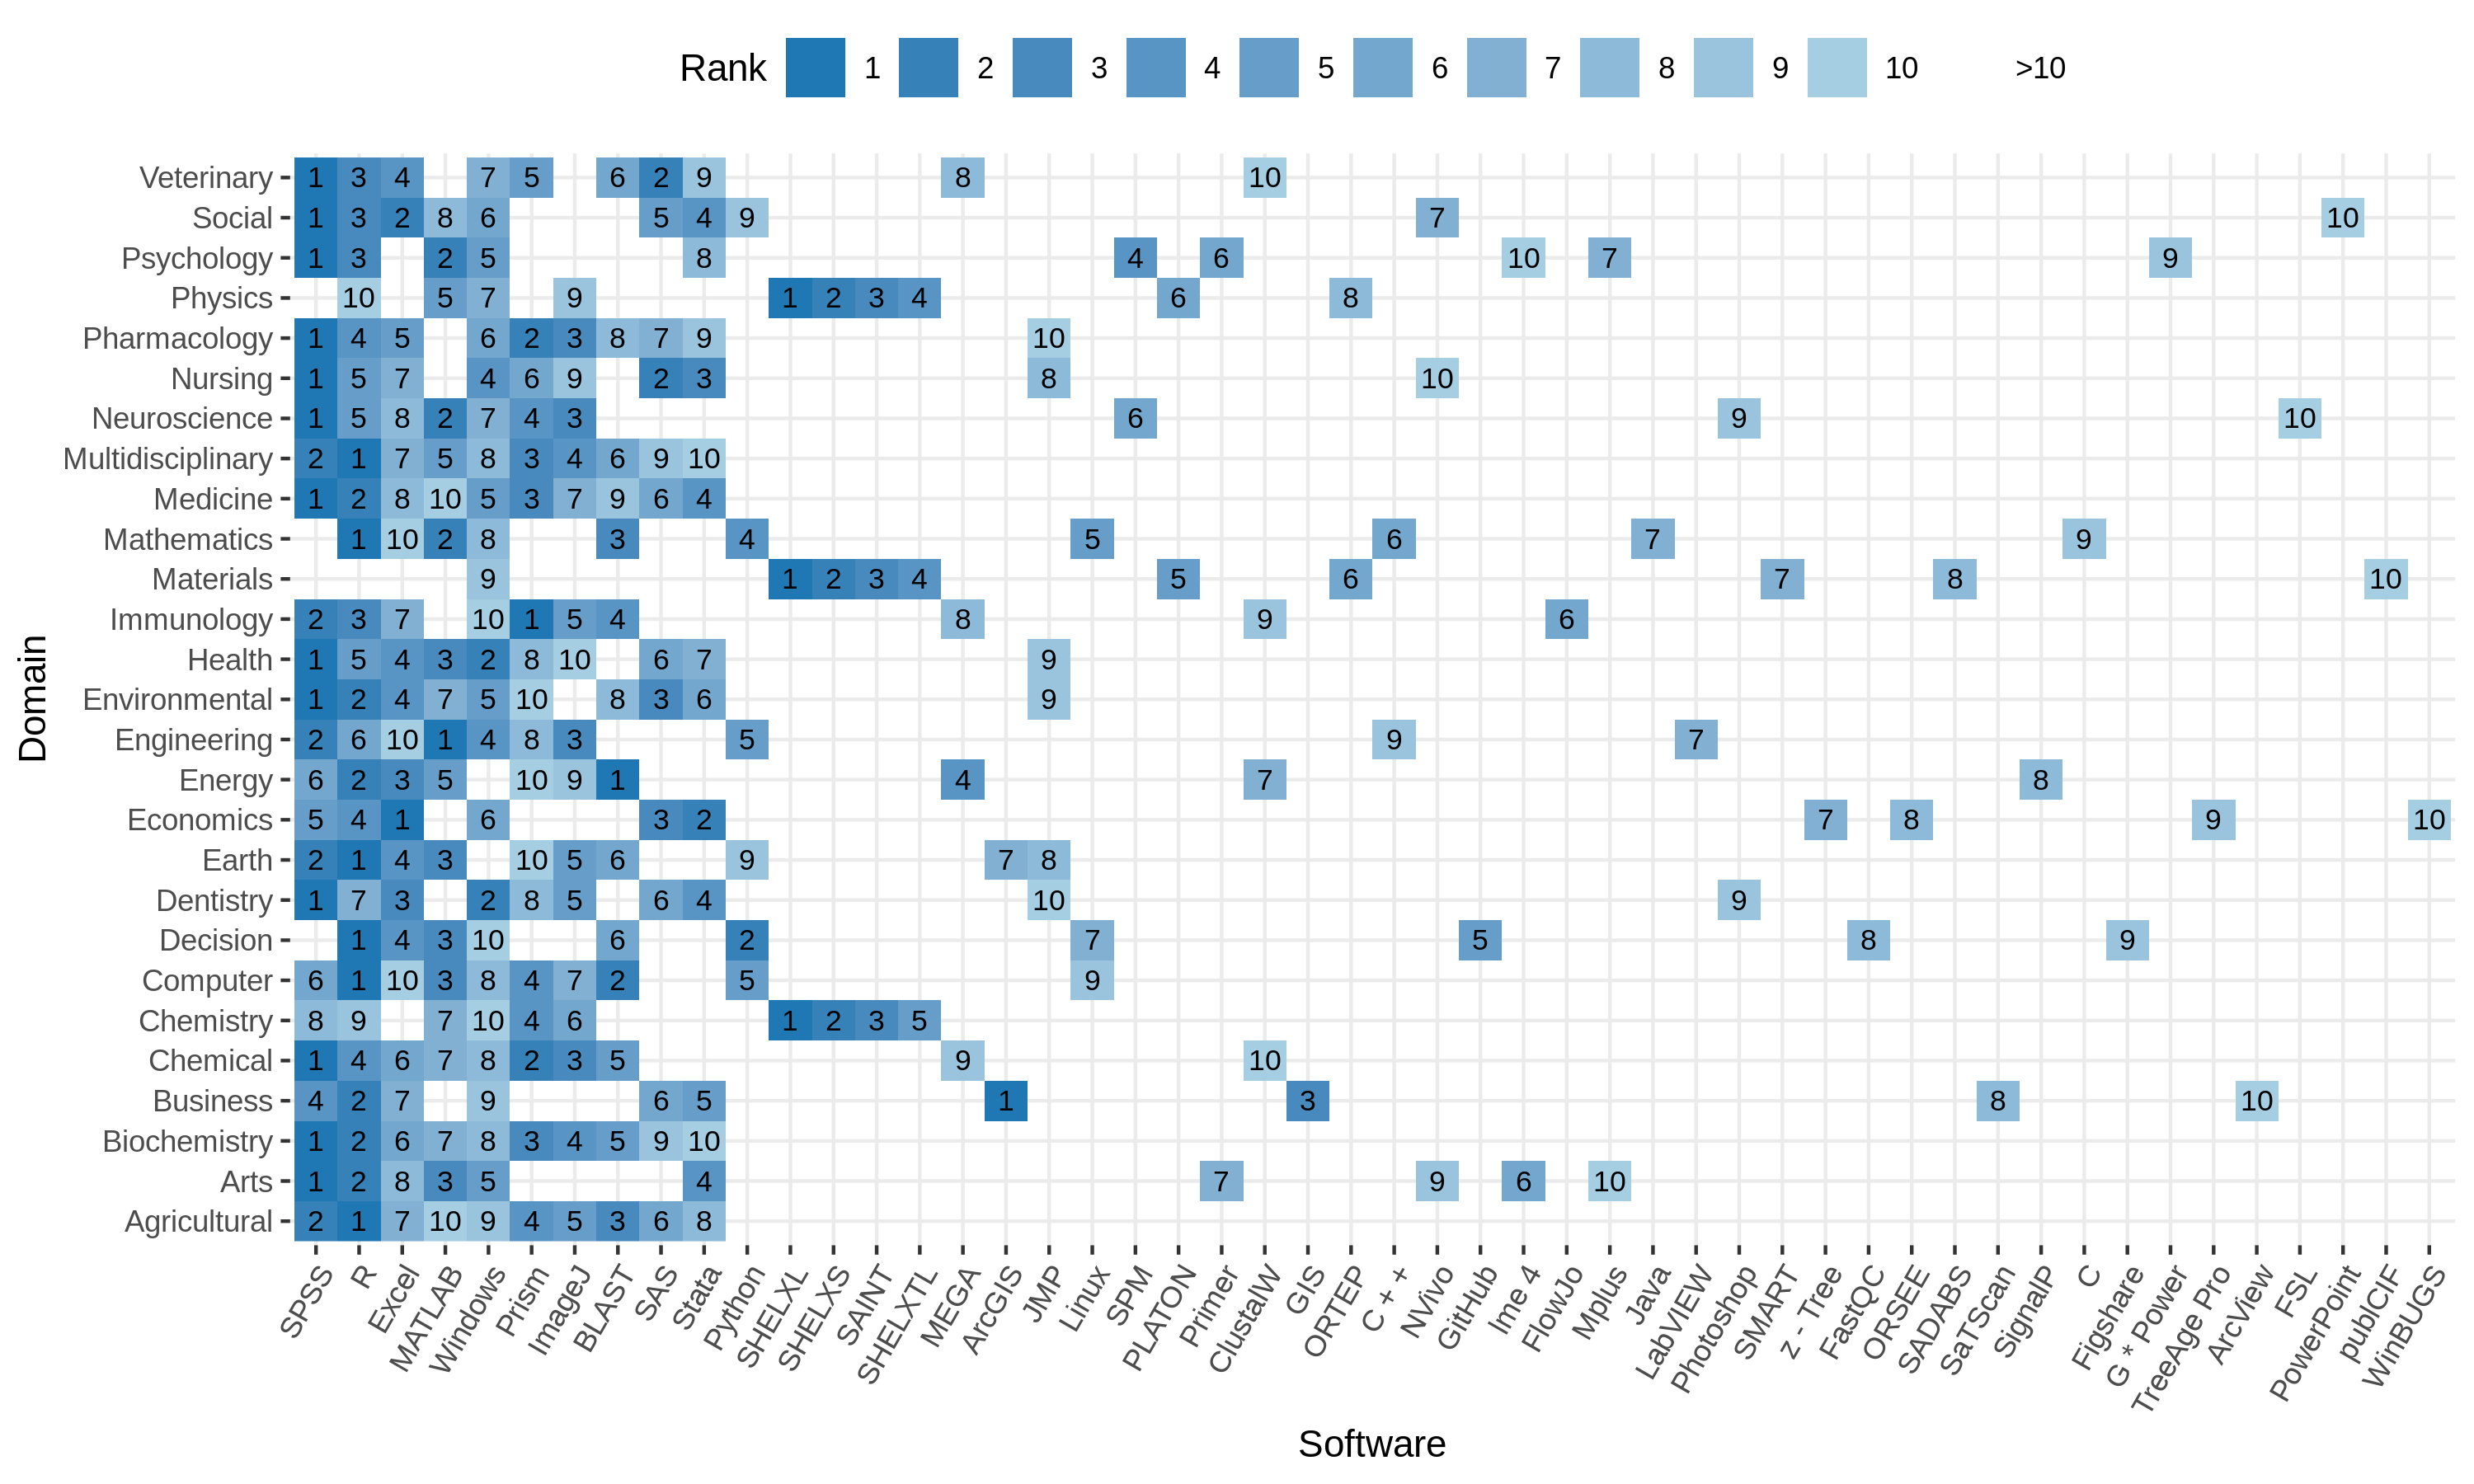
Blue: Relative frequency of articles with at least one software mention per year. Green: Absolute mean frequency of unique software mentioned per article with at least one software mention per year. Please note that standard deviations are at the same level at the actual mean values but are omitted here for reasons of readability.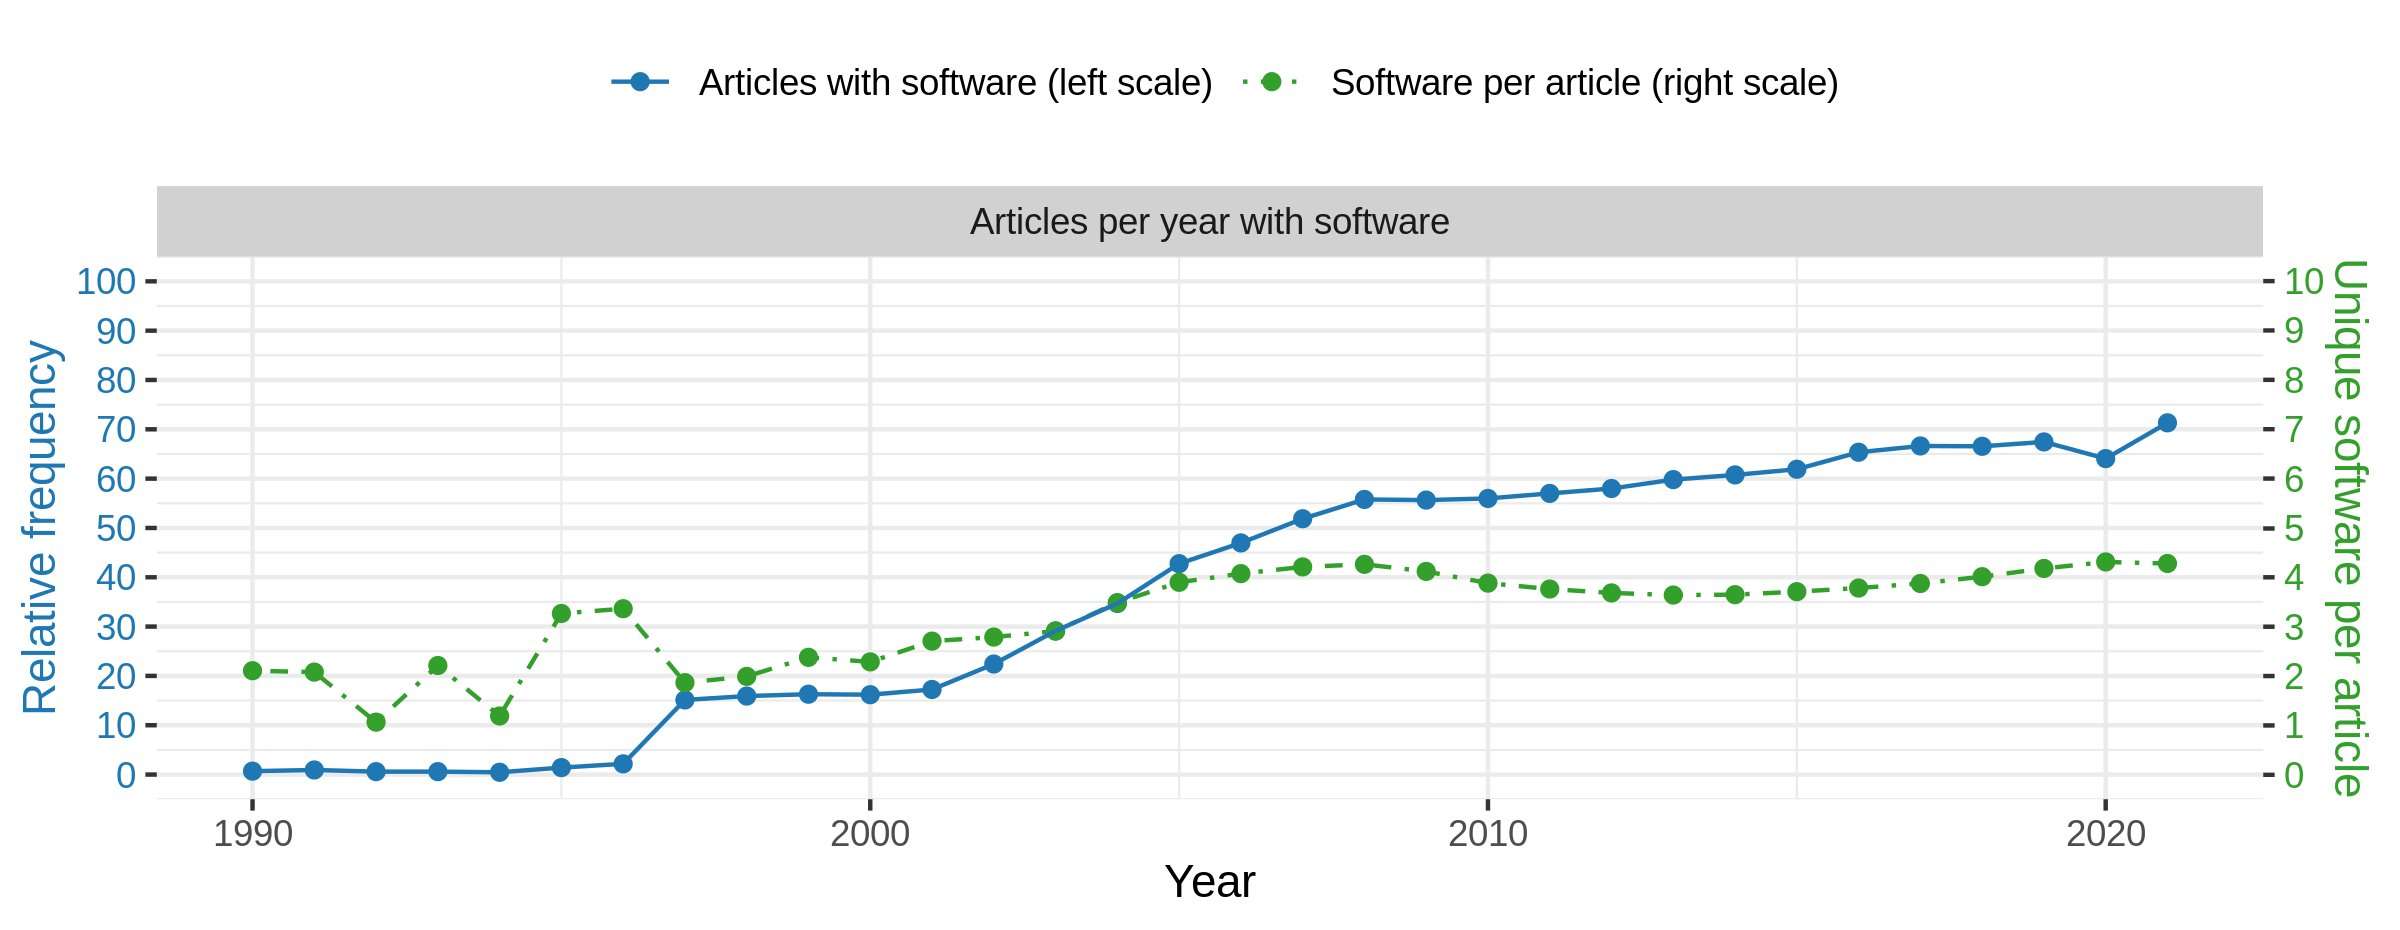
Blue: Relative frequency of articles with at least one software mention per research domain. Green: Mean different software mentioned per article with at least one software mention per research domain. Note that standard deviation are very large (similar to mean values) and are omitted here.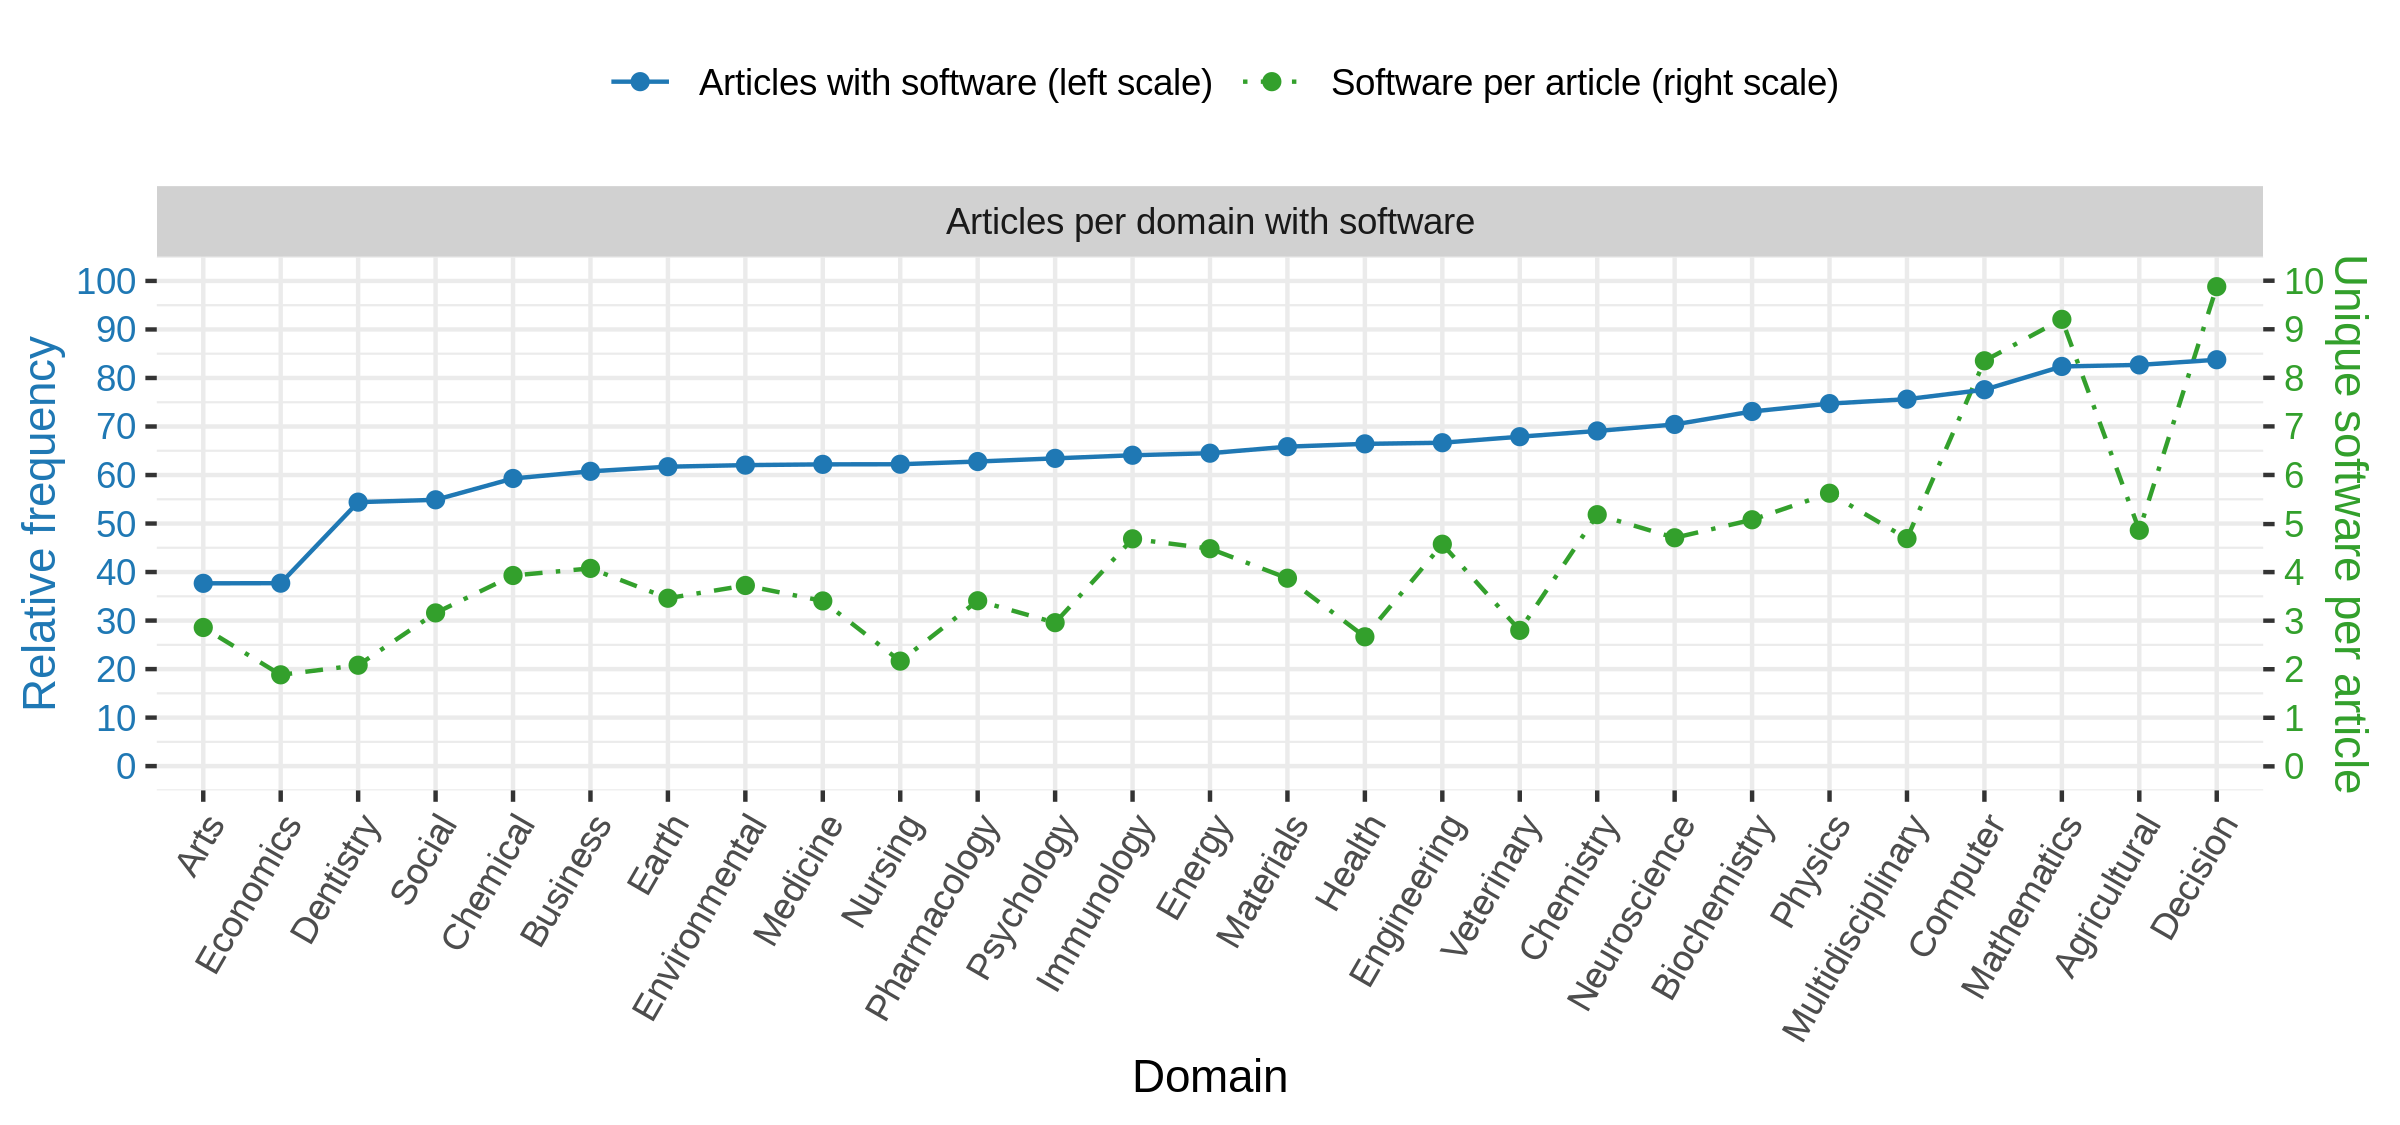
Blue: Relative frequency of articles that contain at least one software mention per journal rank. Green: Average number of different software per article. Note that the very high standard deviation are left out to increase readability.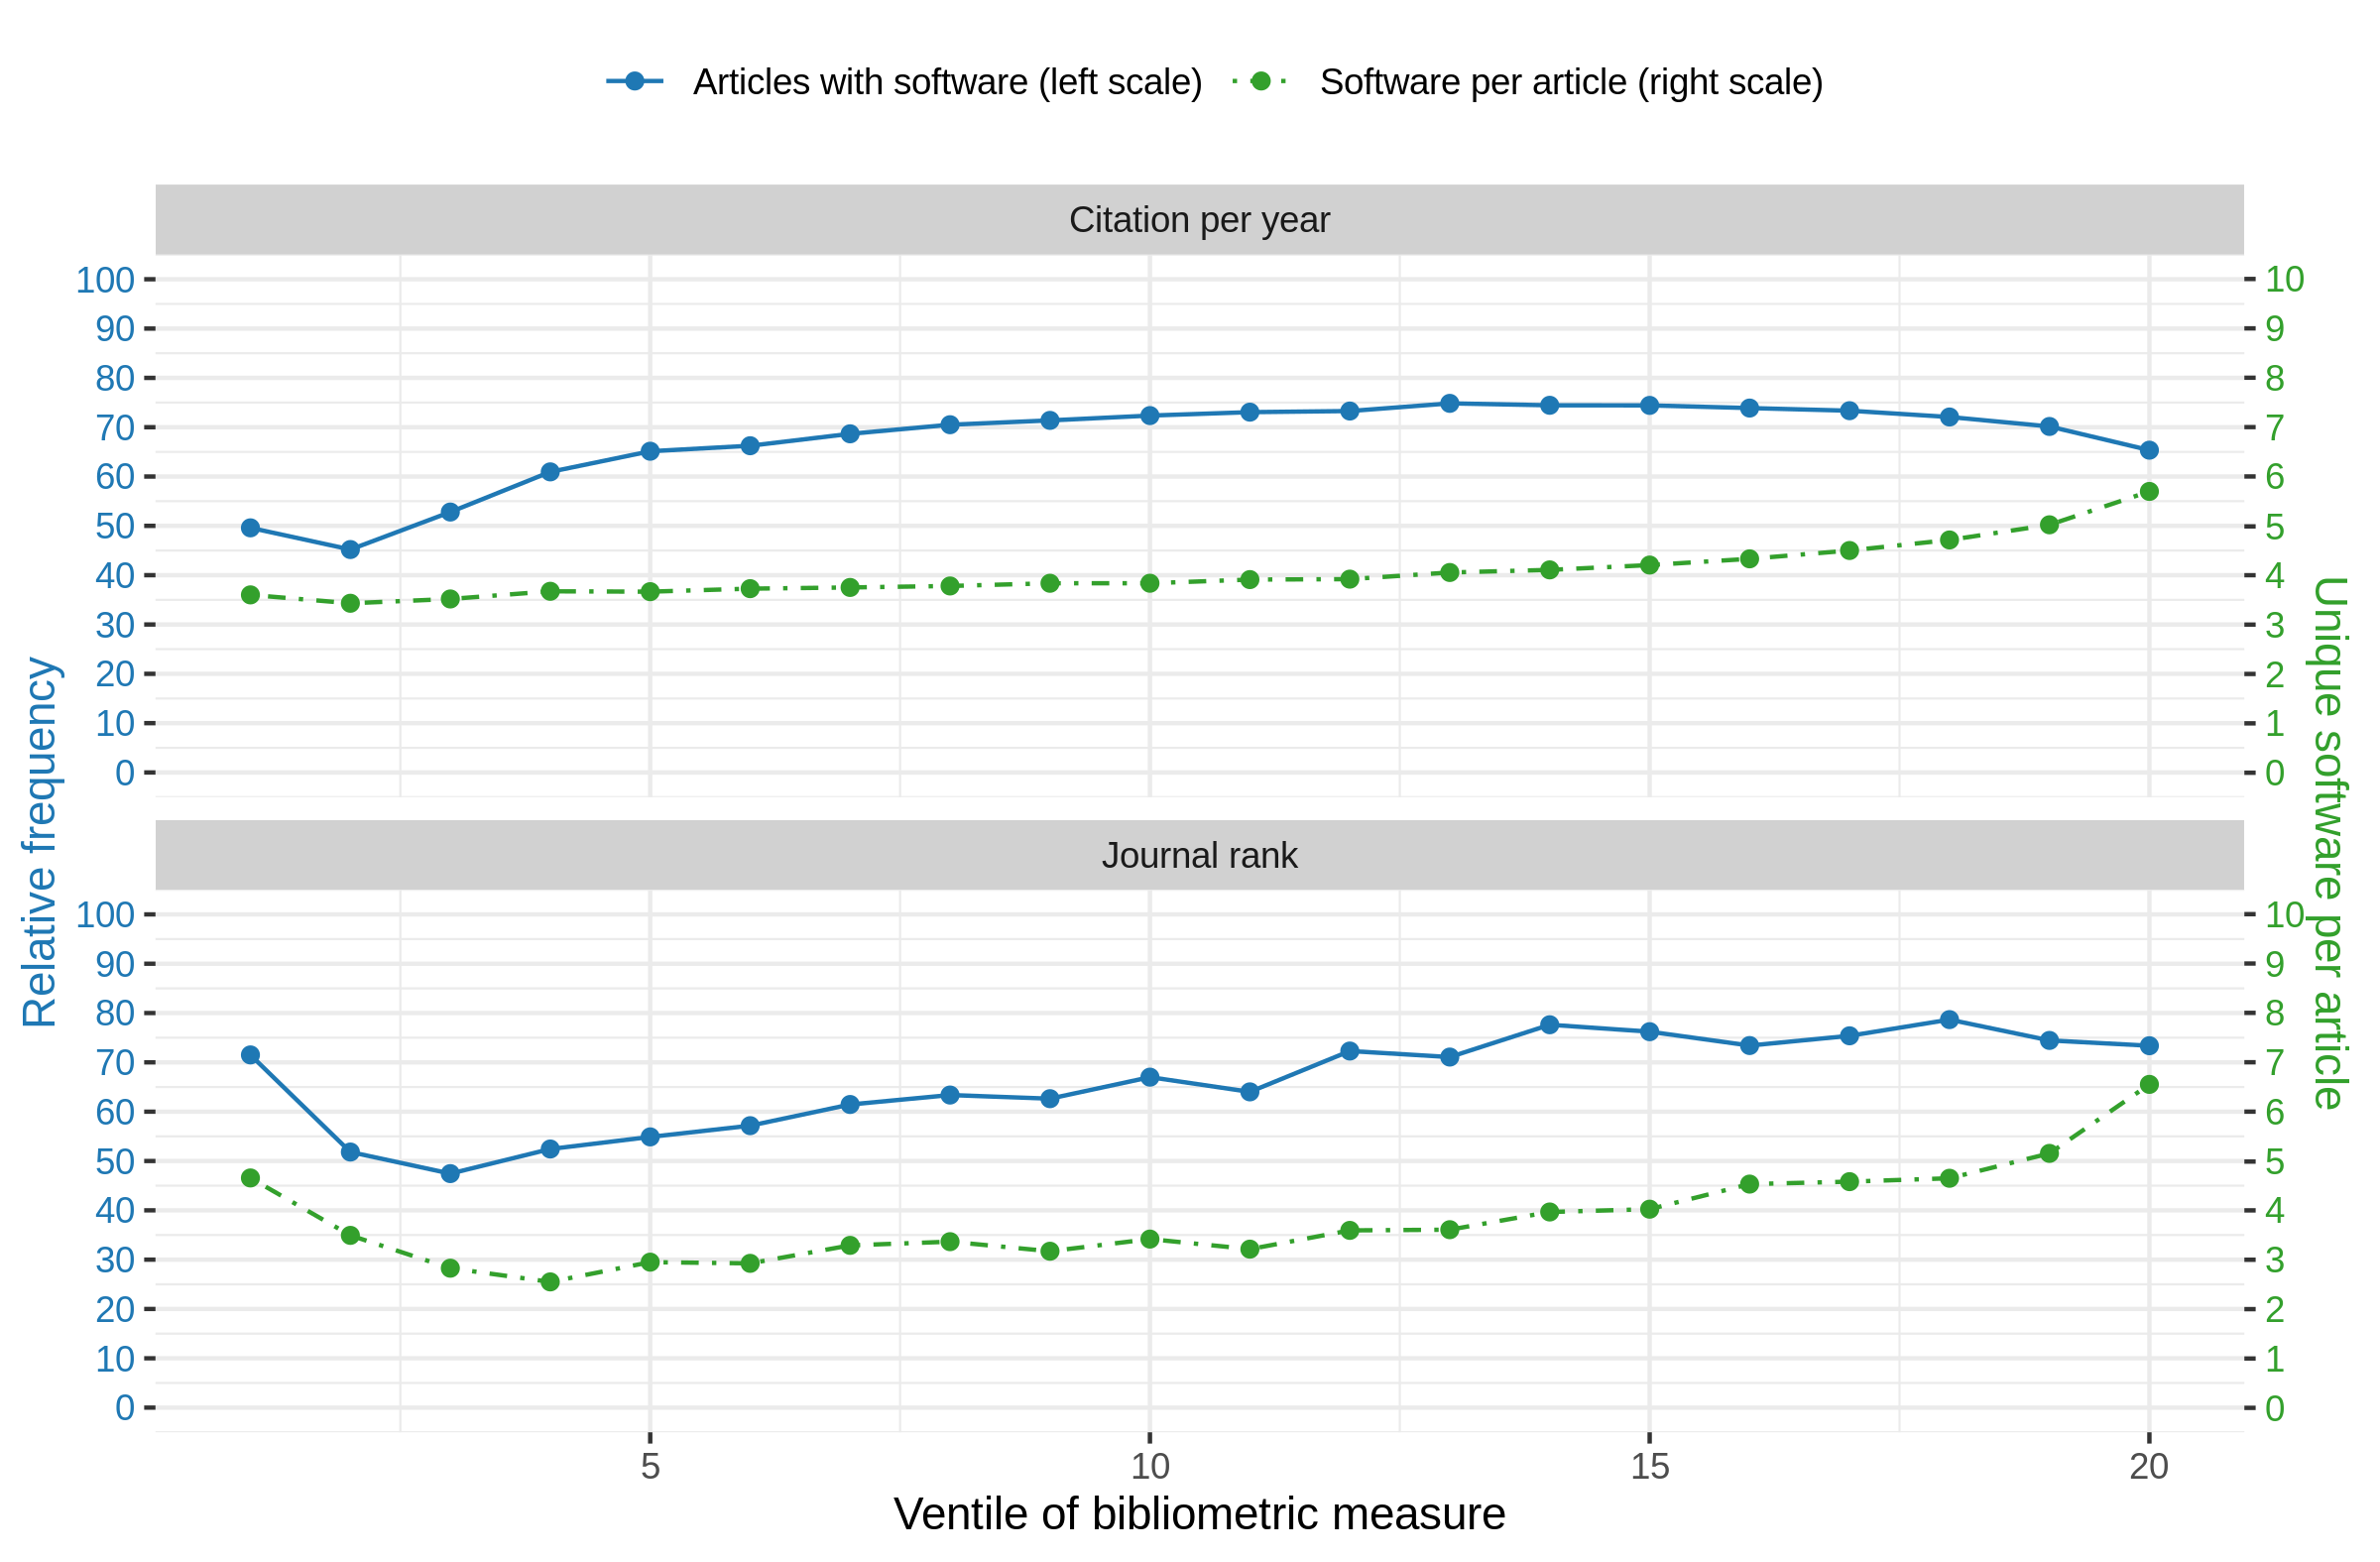
Progression of software usage, mention and citation practices over time. Top shows progress of overall software mentions and the percentage of articles mentioning at least one software with further information. Bottom shows the percentage of unique software per article that is cited with provided additional information. The bars present different levels of completeness while the line chart separately indicated how many software mentions were accompanied by a formal citation.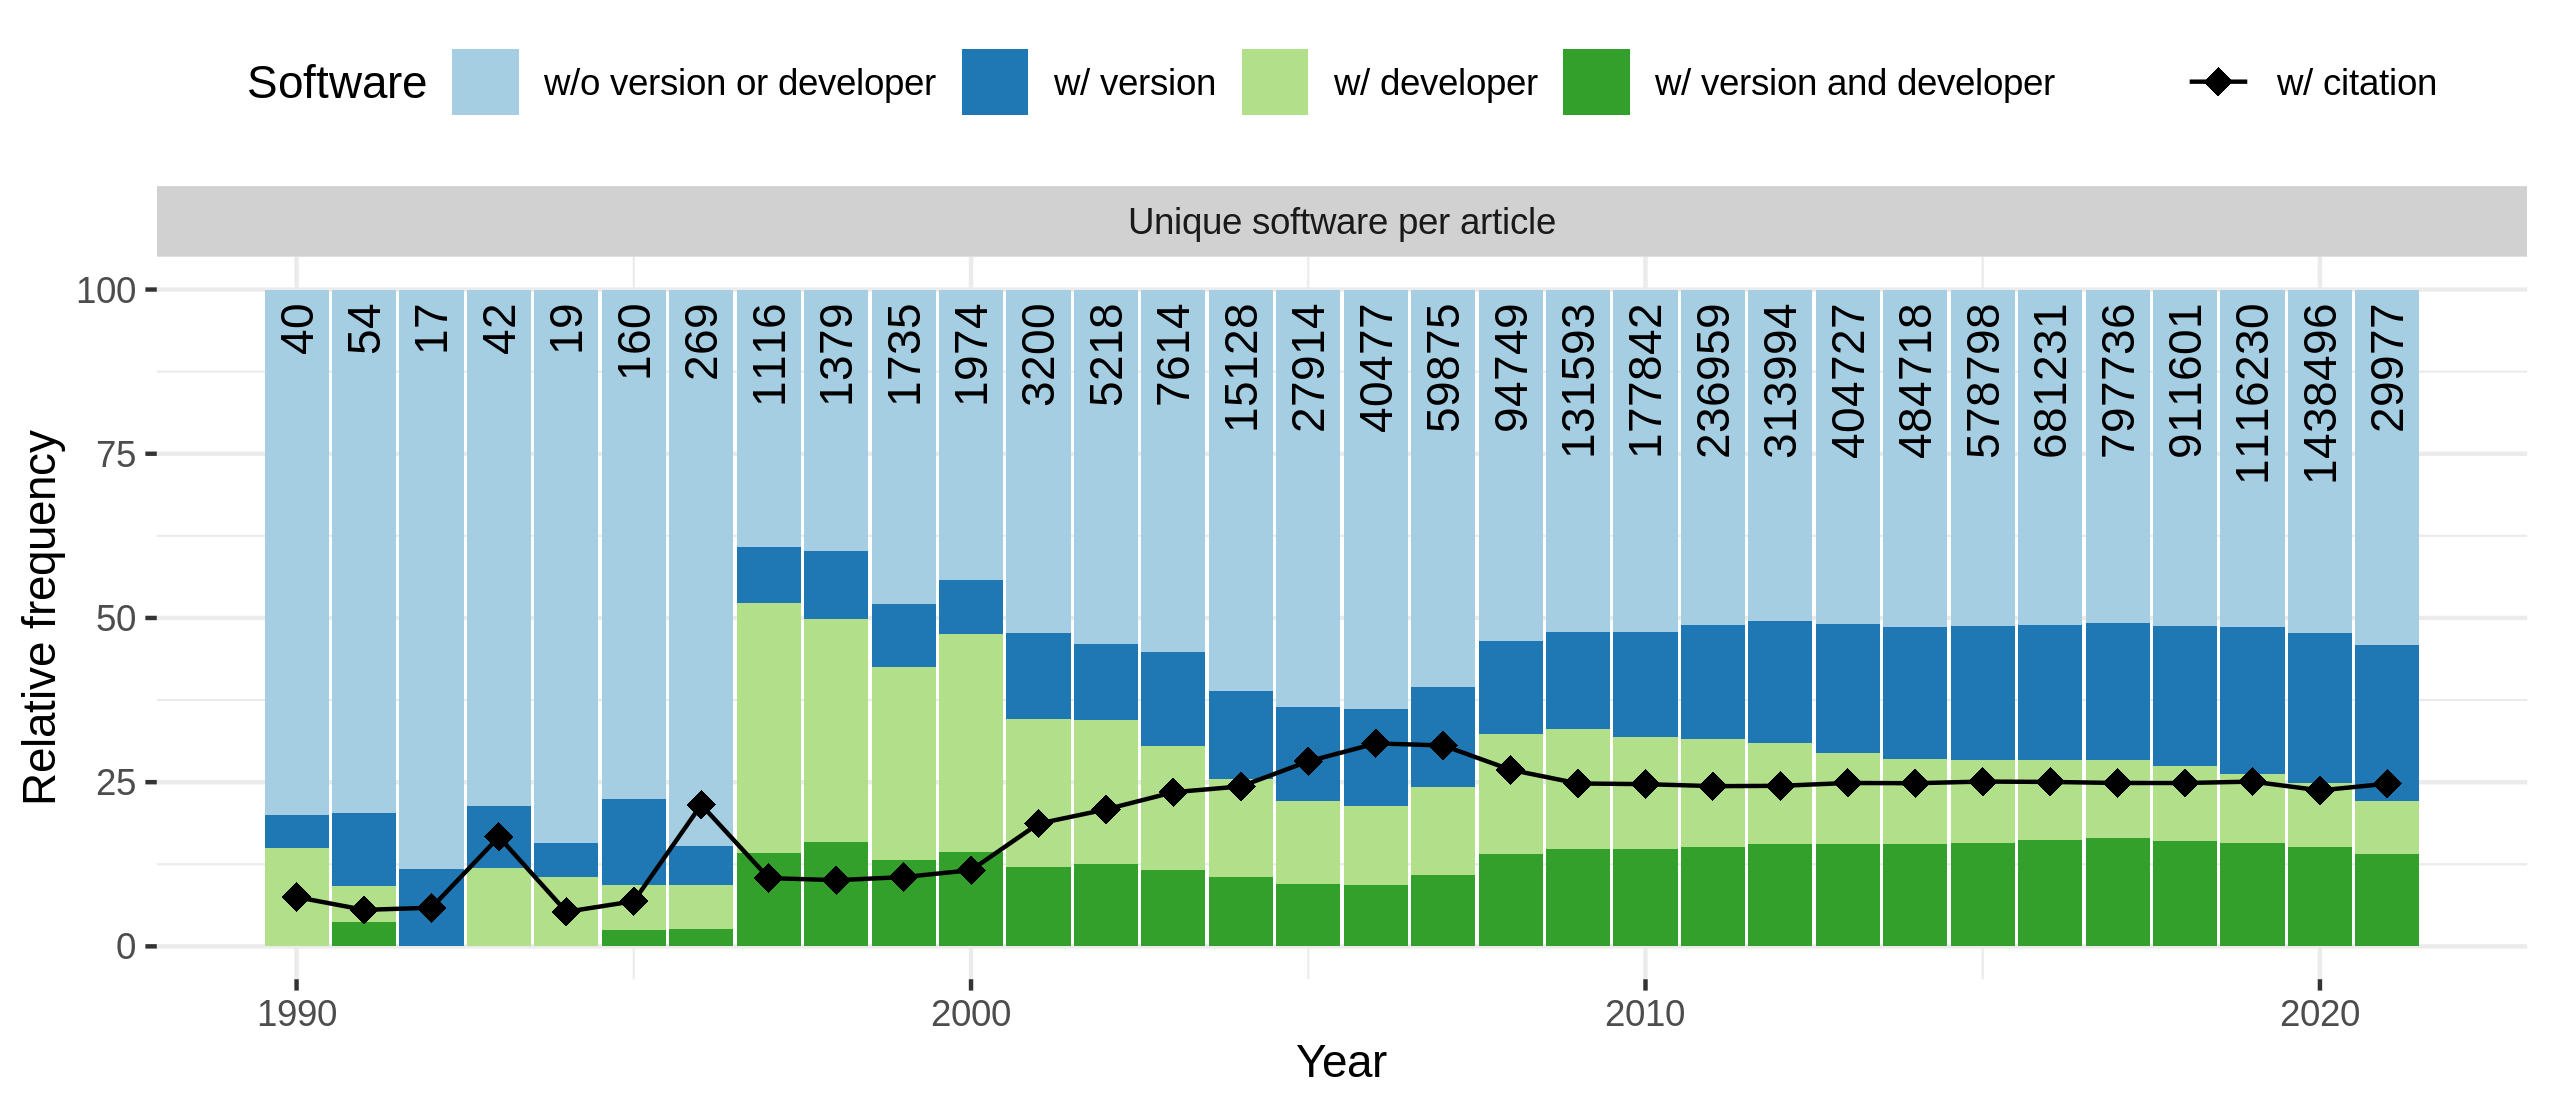
Distribution of software complete per research domain. The numbers at the top of the bars represent the absolute of software considered per domain. Please note that articles may belong to multiple categories.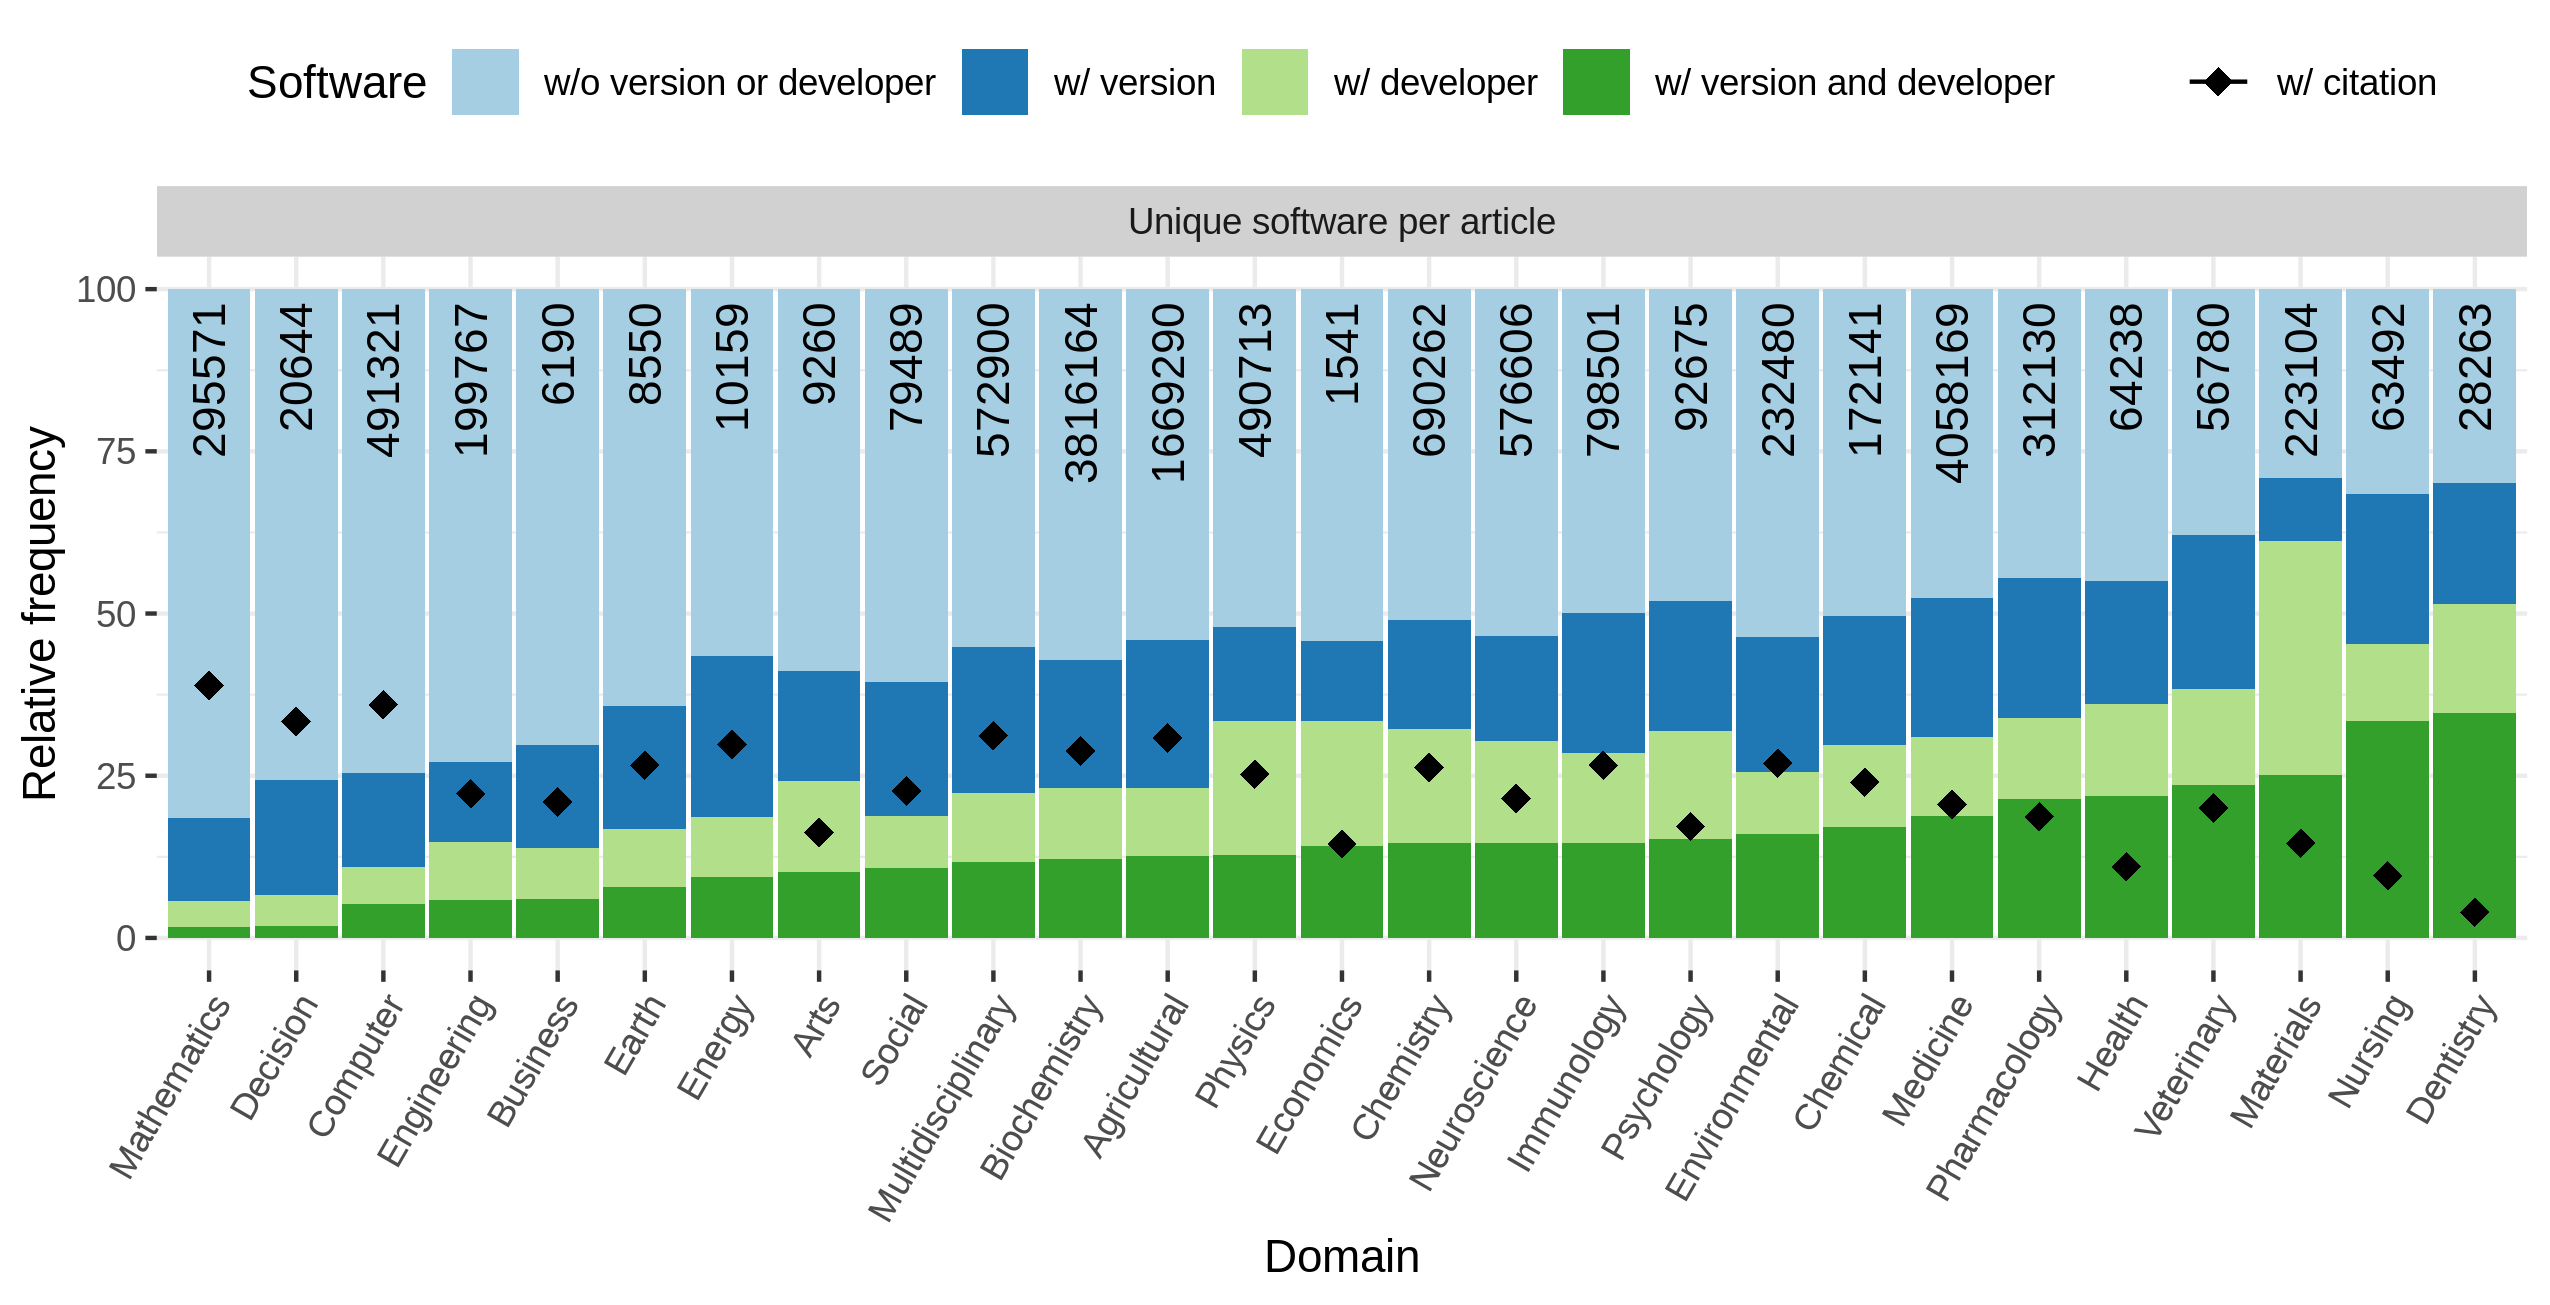
Distribution of software completeness per ventile of journal rank per research domains. The numbers at the top of the bars represent the absolute numbers considered per ventiles.![]()
Distribution of software completeness per ventile of citation count per research domain. Note that only articles published before 2020 were included to prevent a bias towards lower citation ventiles.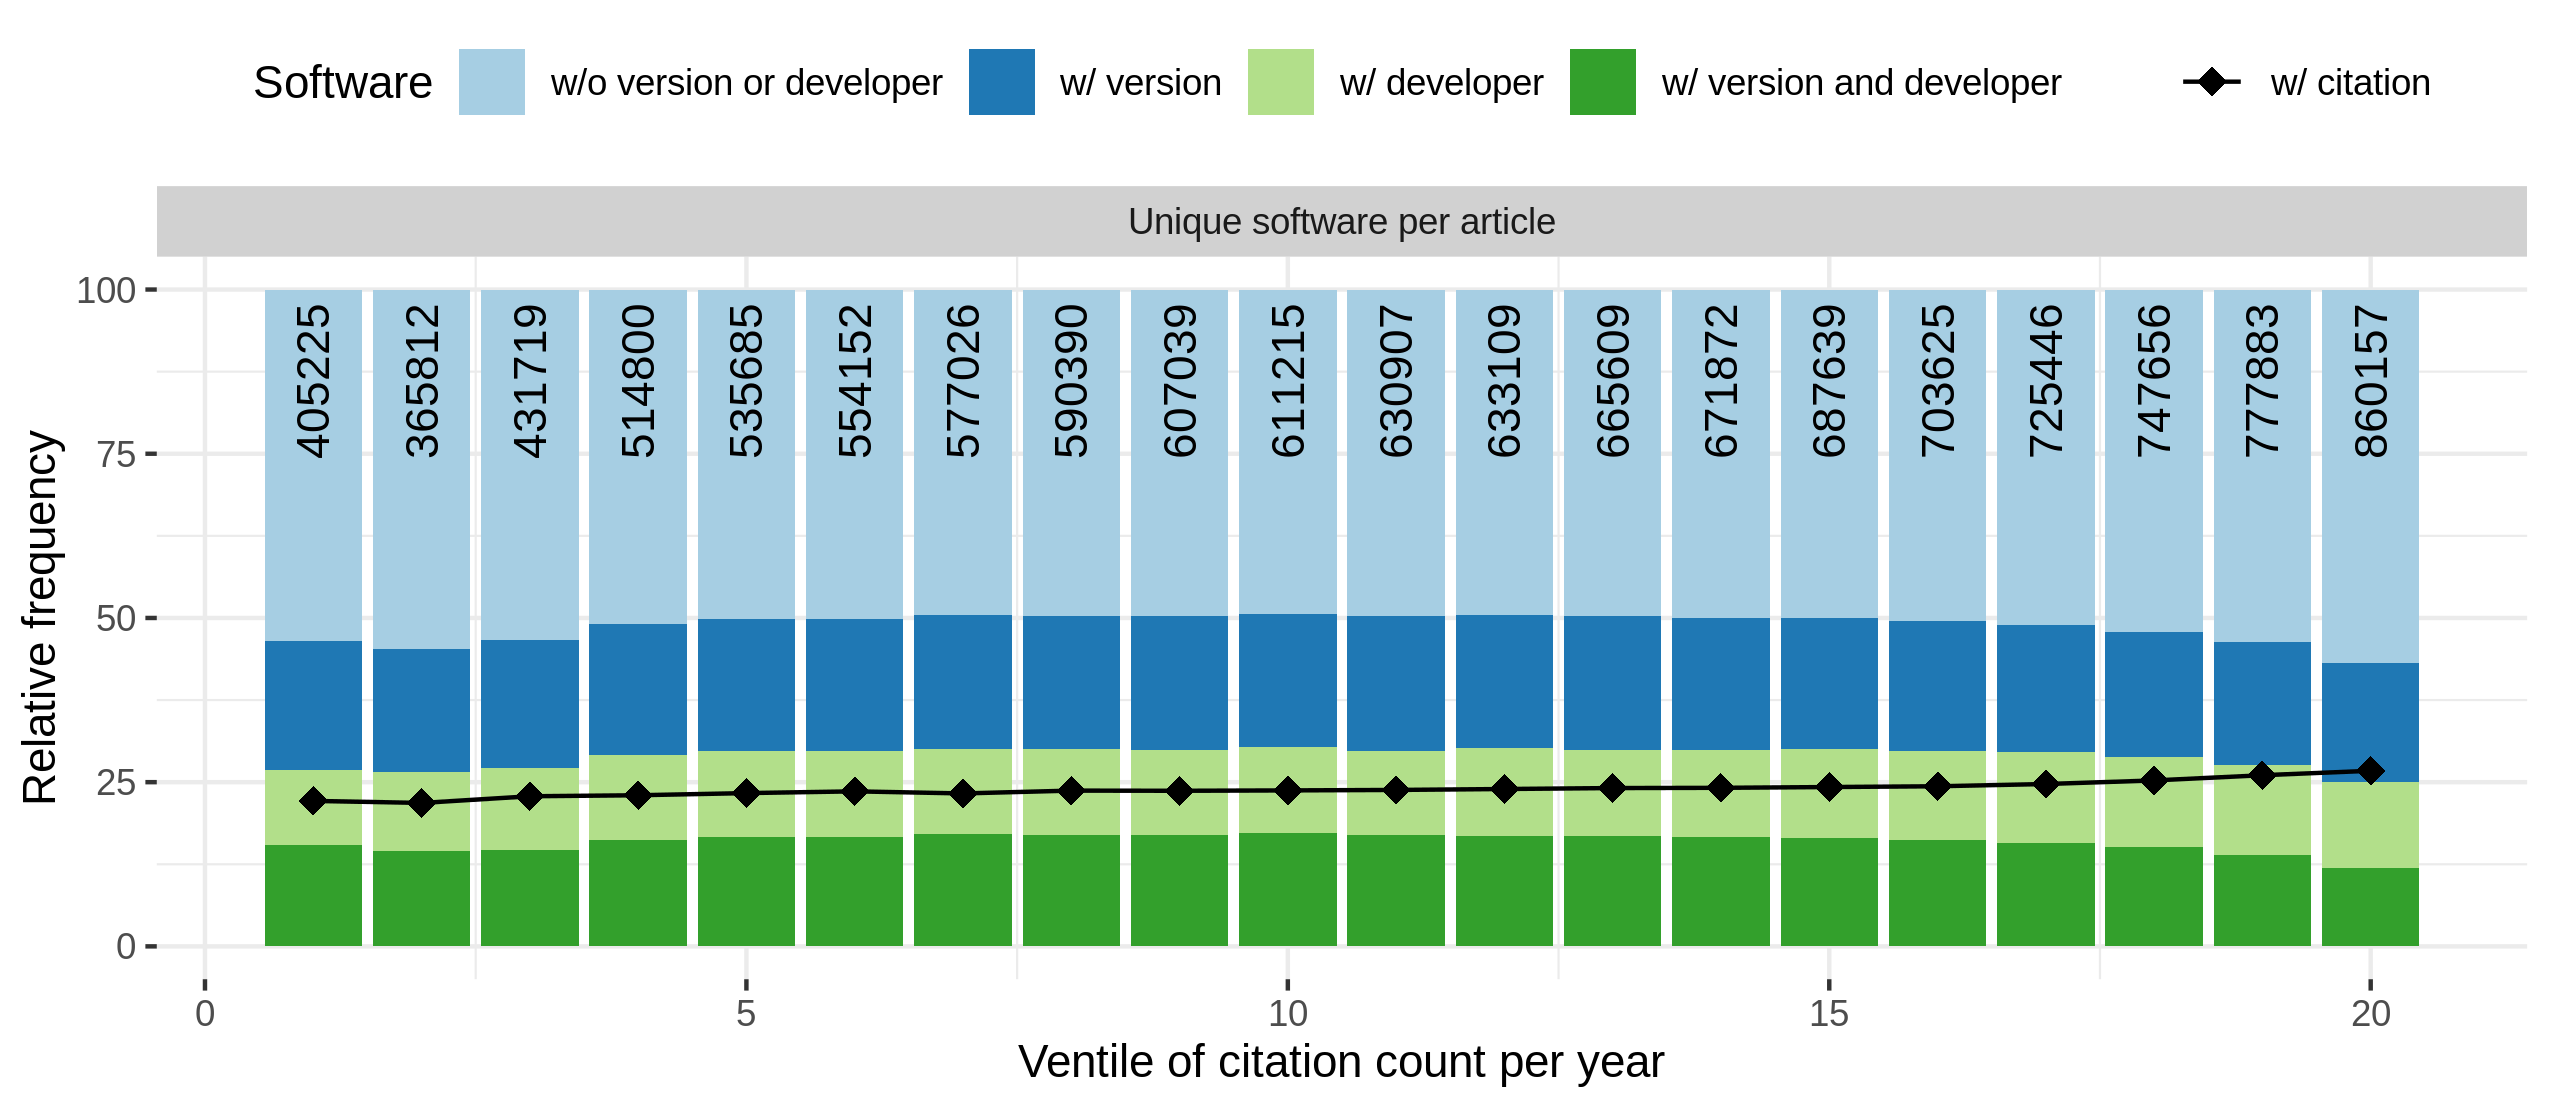
Relative and absolute amount of articles per year mentioning the top statistical software.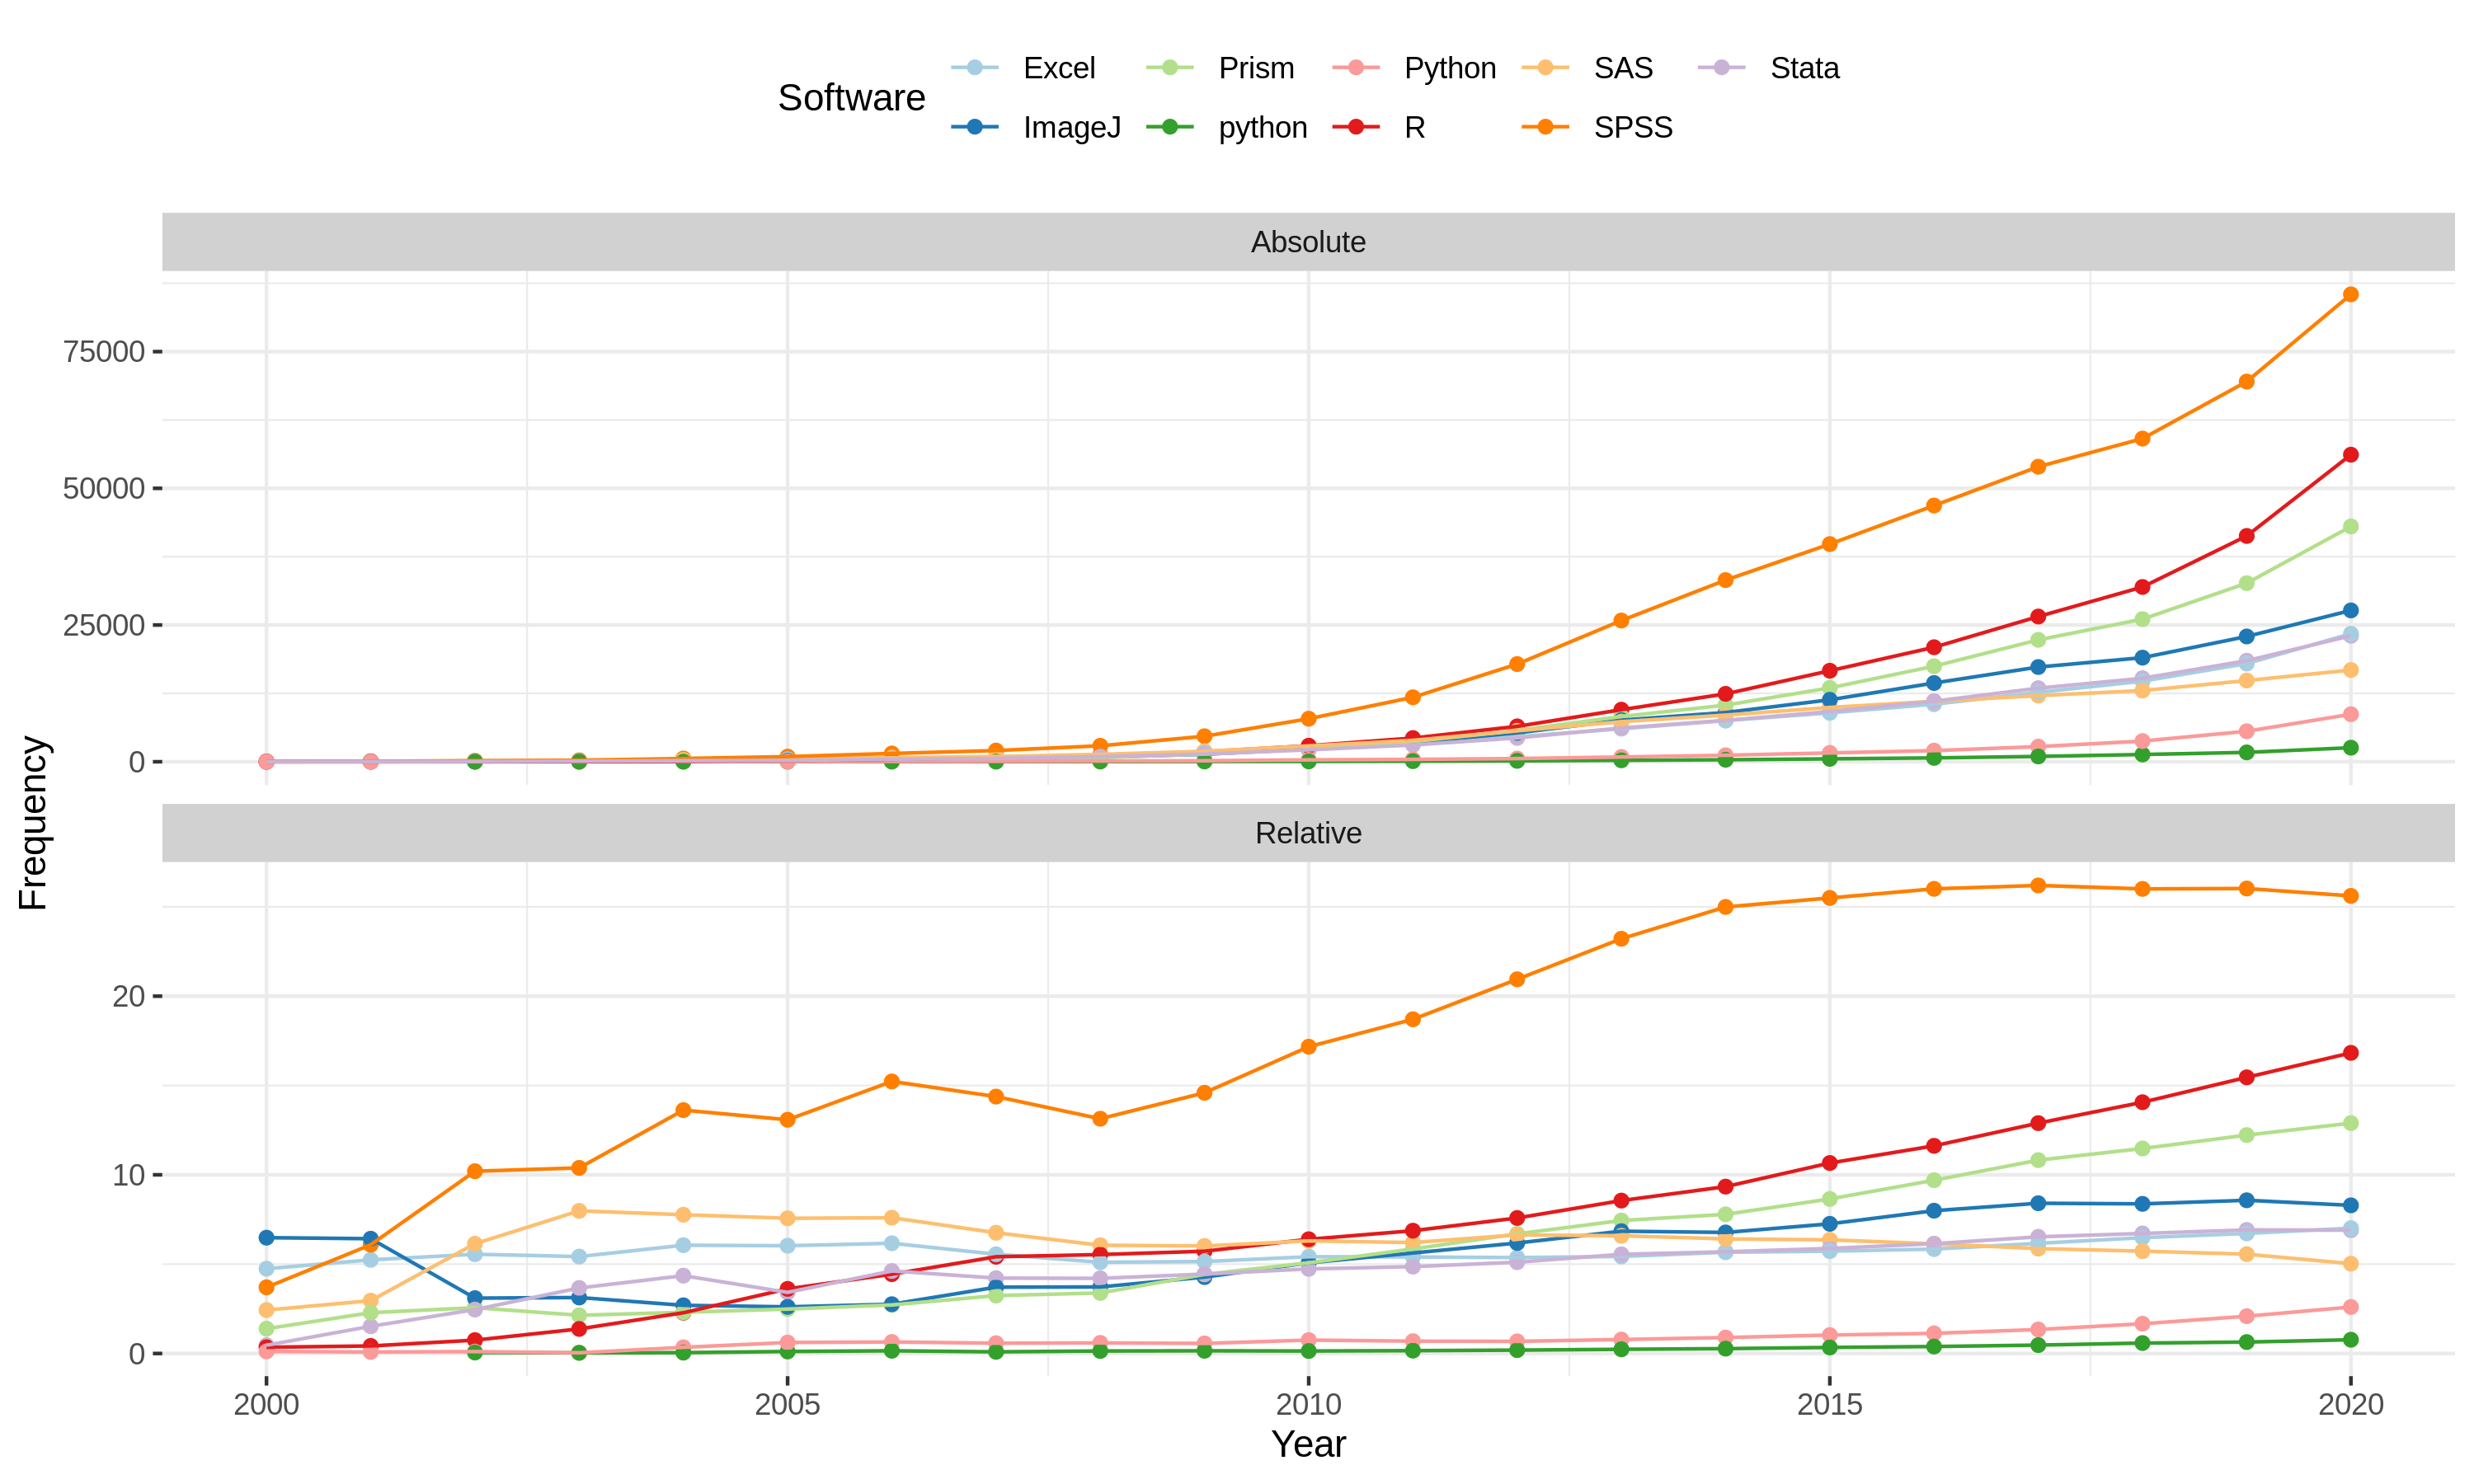
The latest release of SoftwareKG_PubMed can be downloaded at https://doi.org/10.5281/zenodo.5553738.
The source code for reproduction of analysis is available on GitHub at https://github.com/f-krueger/SoftwareKG-PMC-Analysis.
The dataset is published under a Creative Commons Attribution 4.0 license.
Schindler D, Bensmann F, Dietze S, Krüger F. 2022. The role of software in science: a knowledge graph-based analysis of software mentions in PubMed Central. PeerJ Computer Science 8:e835 https://doi.org/10.7717/peerj-cs.835
Please provide your feedback and any comments by sending an email to softwarekg (at) gesis (dot) org
David Schindler, ORCID ID: 0000-0003-4203-8851, University Rostock, https://www.int.uni-rostock.de/
Felix Bensmann, GESIS - Leibniz Institute for the Social Sciences (Germany), https://www.gesis.org/
Stefan Dietze, GESIS - Leibniz Institute for the Social Sciences (Germany), https://www.gesis.org/
Frank Krüger, ORCID ID: 0000-0002-7925-3363, University Rostock, https://www.int.uni-rostock.de/